
VolSurface Dynamics
It is a hot topic for active vol traders and a research subject for quants.
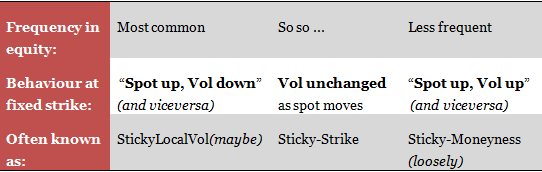
It is normally assumed that the implied volatility at a given strike and expiry will decrease when the spot price of the underlying moves up, and viceversa
Over the last 20 years~ or so this has been the most common regime, which somehow tallies with the equity skew is (nearly always) negative, i.e. the implied vol at a given maturity increases with decreasing strike.
While this is often the case, it is far from a constant behaviour.
For example, note the dynamics between march 2013 and april-may: spot up, vol up...
|
Vol ATM 3mo |
Vol ATM 2y |
Skew |
Spot |
AsOf |
|
|
SPX |
13.8% |
17.9% |
-28.0% |
1566.63 |
16-Apr-13 |
|
Eurostoxx |
17.3% |
20.7% |
-19.2% |
2814 |
21-May-13 |
|
FTSE100 |
12.1% |
15.7% |
-27.2% |
6480.4 |
02-Apr-13 |
|
|
Vol ATM 3mo |
Vol ATM 2y |
Skew |
Spot |
AsOf |
|
SPX |
12.6% |
17.3% |
-26.8% |
1549.63 |
08-Mar-13 |
|
Eurostoxx |
16.5% |
19.9% |
-19.0% |
2726.8 |
08-Mar-13 |
|
FTSE100 |
12.0% |
15.6% |
-25.2% |
6469.25 |
08-Mar-13 |
We reported (see article in Reuters) a similar period between May and June 2013: in fact over the last couple of years the "spot up, vol up" dynamic has been quite common (causing losses at some vol-trading houses and hedge funds).
This has probably been due to a decrease of demand for downside protection from the buy-side, with fund managers probably trusting the "Bernanke put", combined with a structural long skew position on the sell-side (driven by the issuance of structured products).
This new "regime" has persisted through 2014, with many cases of "spot up/vol up" or similar "spot down, vol down", while the older normal "spot down, vol up" comes back with a vengeance in period of more serious "wobbles", e.g. Aug-13, or end 2014.
___________________________________________________________________________________________
Disclaimers: all of the above is indicative and approximate, not to be used for investment purposes, should not be taken as solicitation to trade, etc